The 10 largest oil producers in 2025
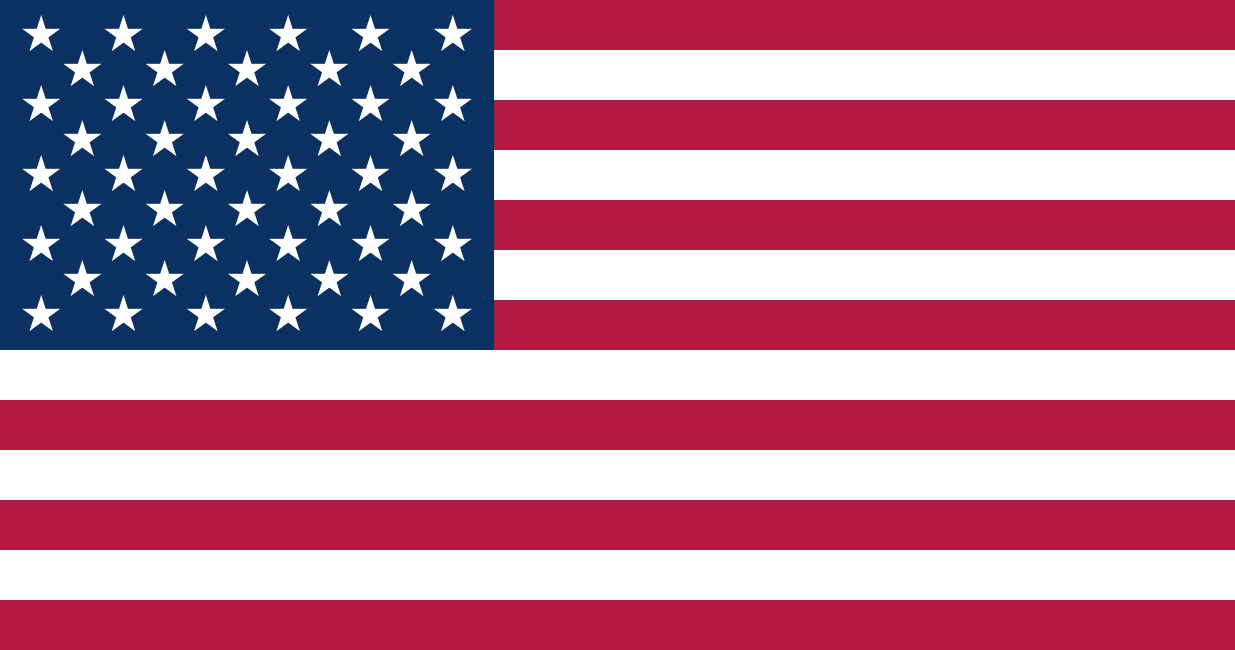 United States13.7M b/d
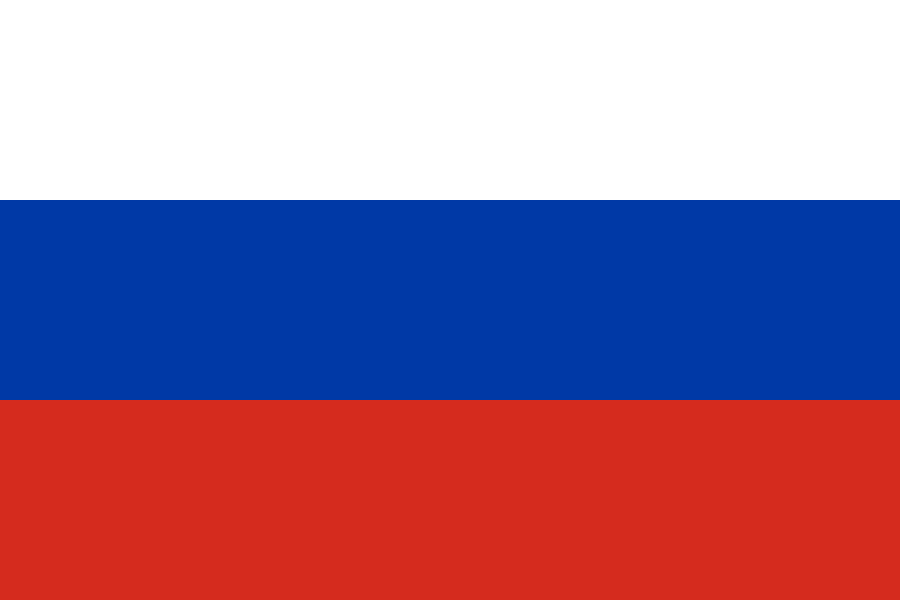 Russia9.9M b/d
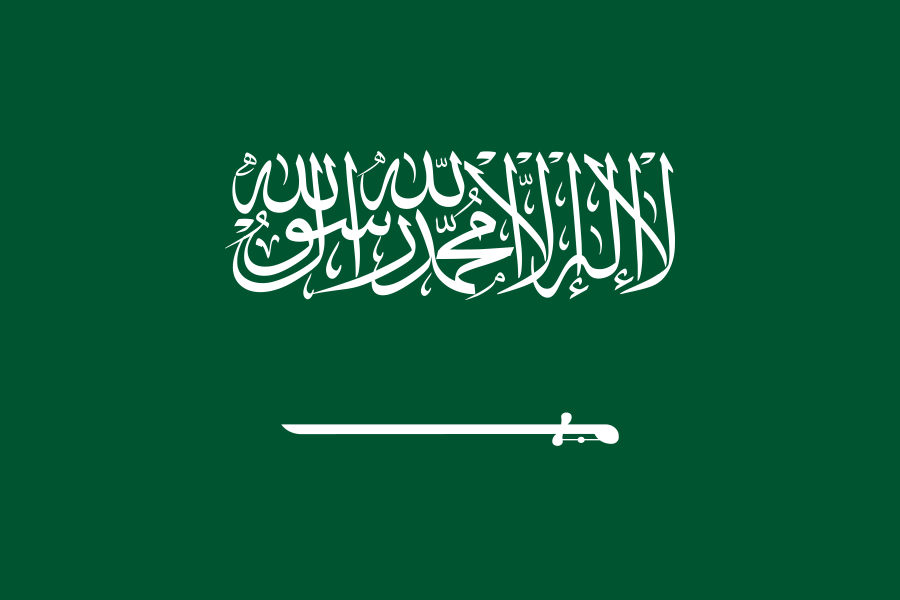 Saudi Arabia9.5M b/d
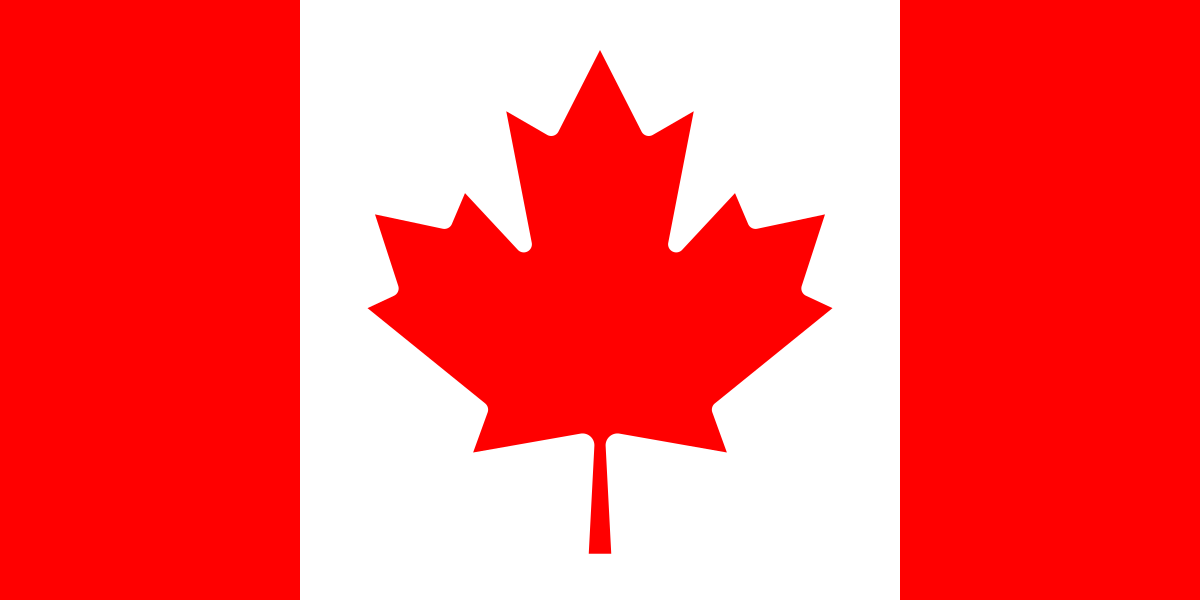 Canada5.0M b/d
 Iraq4.4M b/d
 China4.3M b/d
 Iran4.1M b/d
 United Arab Emirates3.8M b/d
 Brazil3.8M b/d
 Kuwait2.6M b/d
The largest oil producers in the world in 2025
| Rank | Country | Thousand barrels per day · annual average | Annual change | Share of world |
|---|---|---|---|---|
| 1 | United States | 13,661.9 | +3.0% | 16.2% |
| 2 | Russia | 9,885.1 | −0.1% | 11.7% |
| 3 | Saudi Arabia | 9,548.8 | +3.7% | 11.3% |
| 4 | Canada | 4,963.9 | +3.9% | 5.9% |
| 5 | Iraq | 4,388.1 | −1.6% | 5.2% |
| 6 | China | 4,324.7 | +2.1% | 5.1% |
| 7 | Iran | 4,051.4 | +2.7% | 4.8% |
| 8 | United Arab Emirates | 3,771.2 | +2.6% | 4.5% |
| 9 | Brazil | 3,769.4 | +12.3% | 4.5% |
| 10 | Kuwait | 2,583.5 | +1.3% | 3.1% |
| 11 |  Kazakhstan | 2,046.6 | +13.7% | 2.4% |
| 12 |  Norway | 1,858.5 | +3.8% | 2.2% |
| 13 |  Mexico | 1,726.0 | −6.3% | 2.0% |
| 14 |  Nigeria | 1,605.4 | +7.8% | 1.9% |
| 15 |  Libya | 1,363.0 | +17.2% | 1.6% |
| 16 |  Qatar | 1,297.4 | +0.3% | 1.5% |
| 17 |  Algeria | 1,143.0 | +2.1% | 1.4% |
| 18 |  Angola | 1,030.8 | −9.2% | 1.2% |
| 19 |  Oman | 1,002.1 | +1.0% | 1.2% |
| 20 |  Venezuela | 972.6 | +12.6% | 1.2% |
| 21 |  Argentina | 794.0 | +13.3% | 0.9% |
| 22 |  Guyana | 747.4 | +21.1% | 0.9% |
| 23 |  Colombia | 746.5 | −3.4% | 0.9% |
| 24 |  United Kingdom | 615.8 | +3.7% | 0.7% |
| 25 |  Indonesia | 581.7 | −0.1% | 0.7% |
| 26 |  India | 580.6 | −1.6% | 0.7% |
| 27 |  Azerbaijan | 571.3 | −3.4% | 0.7% |
| 28 |  Malaysia | 512.7 | +7.2% | 0.6% |
| 29 |  Egypt | 504.8 | −6.0% | 0.6% |
| 30 |  Ecuador | 440.7 | −7.3% | 0.5% |
| 31 |  Australia | 245.6 | −9.2% | 0.3% |
| 32 |  Congo-Brazzaville | 241.2 | −2.4% | 0.3% |
| 33 |  Gabon | 239.3 | +11.3% | 0.3% |
| 34 |  Turkmenistan | 190.7 | 0.0% | 0.2% |
| 35 |  Ghana | 183.0 | −2.5% | 0.2% |
| 36 |  Bahrain | 175.8 | +1.1% | 0.2% |
| 37 |  Vietnam | 164.7 | +1.1% | 0.2% |
| 38 |  Thailand | 161.6 | +5.6% | 0.2% |
| 39 |  Chad | 126.5 | −0.6% | 0.1% |
| 40 |  Turkiye | 124.6 | +22.2% | 0.1% |
| 41 |  South Sudan | 112.7 | +42.8% | 0.1% |
| 42 |  Niger | 101.4 | +231.8% | 0.1% |
| 43 |  Brunei | 100.9 | +6.9% | 0.1% |
| 44 |  Senegal | 100.0 | +174.9% | 0.1% |
| 45 |  Italy | 83.7 | −1.4% | 0.1% |
| 46 |  Equatorial Guinea | 76.4 | −11.9% | 0.1% |
| 47 |  Syria | 75.2 | +39.0% | 0.1% |
| 48 |  Denmark | 71.8 | +19.8% | 0.1% |
| 49 |  Cameroon | 59.2 | −3.7% | 0.1% |
| 50 |  Pakistan | 57.5 | −12.7% | 0.1% |
| 51 |  Cote d'Ivoire | 55.1 | +52.2% | 0.1% |
| 52 |  Romania | 51.5 | −6.8% | 0.1% |
| 53 |  Trinidad and Tobago | 51.2 | +1.0% | 0.1% |
| 54 |  Peru | 44.2 | +8.7% | 0.1% |
| 55 |  Germany | 31.6 | +9.9% | <0.1% |
| 56 |  Papua New Guinea | 31.5 | −2.4% | <0.1% |
| 57 |  Ukraine | 31.2 | −1.0% | <0.1% |
| 58 |  Sudan | 30.0 | −20.0% | <0.1% |
| 59 |  Uzbekistan | 29.6 | −4.9% | <0.1% |
| 60 |  Belarus | 25.7 | −6.8% | <0.1% |
| 61 |  Cuba | 25.5 | −9.8% | <0.1% |
| 62 |  Tunisia | 25.3 | −6.1% | <0.1% |
| 63 |  Hungary | 23.4 | +10.3% | <0.1% |
| 64 |  Netherlands | 21.5 | −10.0% | <0.1% |
| 65 |  Israel | 19.5 | +8.4% | <0.1% |
| 66 |  Bolivia | 17.7 | −14.7% | <0.1% |
| 67 |  Poland | 16.5 | +2.9% | <0.1% |
| 68 |  Congo-Kinshasa | 16.0 | −5.9% | <0.1% |
| 69 |  Yemen | 15.0 | 0.0% | <0.1% |
| 70 |  Mongolia | 13.7 | −4.9% | <0.1% |
| 71 |  Albania | 12.2 | −6.8% | <0.1% |
| 72 |  Suriname | 12.1 | −7.1% | <0.1% |
| 73 |  Serbia | 11.5 | −6.8% | <0.1% |
| 74 |  France | 10.2 | −7.0% | <0.1% |
| 75 |  Croatia | 9.0 | −6.8% | <0.1% |
| 76 |  Austria | 8.8 | −1.6% | <0.1% |
| 77 |  New Zealand | 7.9 | +16.0% | <0.1% |
| 78 |  Burma | 5.6 | −3.0% | <0.1% |
| 79 |  Kyrgyzstan | 5.5 | −6.8% | <0.1% |
| 80 |  Guatemala | 5.4 | −7.4% | <0.1% |
| 81 |  Japan | 3.1 | −2.1% | <0.1% |
| 82 |  Bangladesh | 3.0 | 0.0% | <0.1% |
| 83 |  Timor-Leste | 2.0 | 0.0% | <0.1% |
| 84 |  Chile | 2.0 | −6.6% | <0.1% |
| 85 |  Greece | 1.5 | 0.0% | <0.1% |
| 86 |  Czechia | 1.3 | −2.6% | <0.1% |
| 87 |  Barbados | 1.0 | 0.0% | <0.1% |
| 87 |  Bulgaria | 1.0 | 0.0% | <0.1% |
| 89 |  Belize | 0.8 | 0.0% | <0.1% |
| 90 |  Lithuania | 0.7 | 0.0% | <0.1% |
| 91 |  Philippines | 0.5 | −2.9% | <0.1% |
| 92 |  South Africa | 0.4 | −18.3% | <0.1% |
| 93 |  Tajikistan | 0.3 | 0.0% | <0.1% |
| 94 |  Georgia | 0.2 | −6.8% | <0.1% |
| 95 |  Taiwan | 0.2 | 0.0% | <0.1% |
| 96 |  Spain | 0.0 | +117.0% | <0.1% |
| 97 |  Morocco | 0.0 | 0.0% | <0.1% |
| 98 |  Jordan | 0.0 | 0.0% | <0.1% |
| 99 |  Slovakia | 0.0 | −24.5% | <0.1% |
Thousand barrels per day · annual average · U.S. Energy Information Administration ↗
Annual change: 2025 compared with 2024. Share of world: share of the combined total of the 99 countries ranked for 2025.
Questions on World's Largest Oil Producers
Which country produces the most oil?
The United States, with 13.66 million barrels per day of crude oil on average in 2025, ahead of Russia (9.89 million) and Saudi Arabia (9.55 million), according to the US Energy Information Administration.
What are the 10 largest oil-producing countries?
Average crude oil production in 2025, in million barrels per day:
- United States: 13.66
- Russia: 9.89
- Saudi Arabia: 9.55
- Canada: 4.96
- Iraq: 4.39
- China: 4.32
- Iran: 4.05
- United Arab Emirates: 3.77
- Brazil: 3.77
- Kuwait: 2.58
When did the United States become the largest oil producer?
In 2018, and it has stayed first every year since. US output almost tripled from 5.0 million barrels per day in 2008 to 13.7 million in 2025. Between 1992 and 2017, first place alternated between Saudi Arabia and Russia.
How much oil does the world produce?
About 84.5 million barrels of crude oil per day in 2025, adding up the 99 producing countries reported by the EIA.
What is OPEC and how much oil does it produce?
The Organization of the Petroleum Exporting Countries, founded in Baghdad on September 14, 1960 by Iran, Iraq, Kuwait, Saudi Arabia and Venezuela. Its 11 members (Algeria, the Republic of the Congo, Equatorial Guinea, Gabon, Iran, Iraq, Kuwait, Libya, Nigeria, Saudi Arabia and Venezuela) produced 26.2 million barrels of crude oil per day in 2025, 31.0% of world output; Saudi Arabia alone accounts for 36% of the group. The United Arab Emirates, which left OPEC in 2026, produced another 3.8 million barrels per day.
Which country produced the most oil in 1980?
The Soviet Union, with 11.7 million barrels per day, ahead of Saudi Arabia (9.9 million) and the United States (8.6 million).
About the data
Crude oil including lease (field) condensate, EIA product 57: neither OPEC crude alone nor total petroleum liquids. Values are annual averages in barrels per day, not annual totals.
Historical countries remain distinct. Published zeros are kept; country-years without a value are left out, never replaced with zero. EIA may revise the series.
Sources: U.S. Energy Information Administration ↗
Source validation: 2026-10-12.
Page updated